Agent Overview Page in PowerBI
Overview
Agent Overview page will focus on all Agent related insights.
Filtering
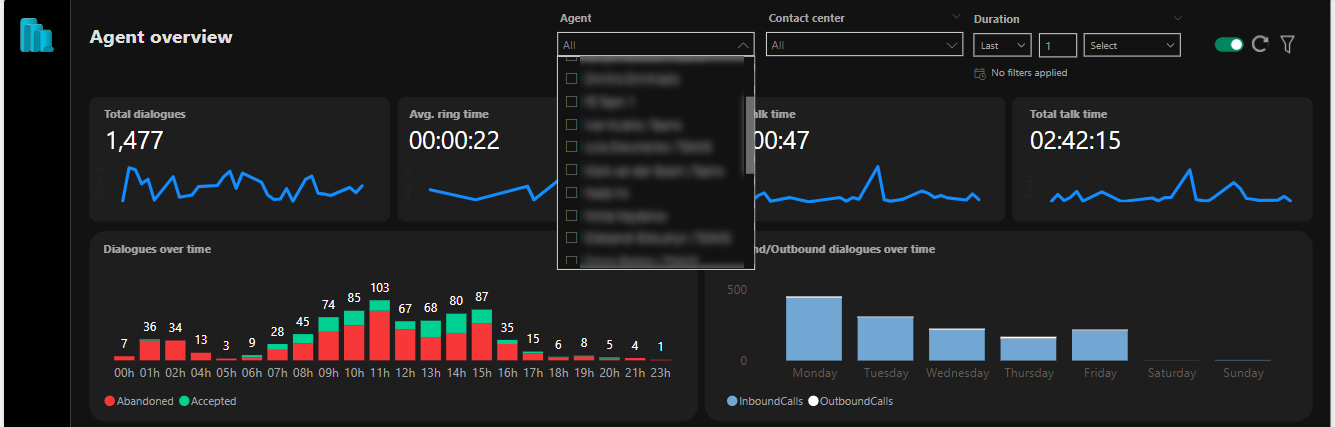
A new filtering (slicing) of this page is introduced for Agents, in addition to the previous filtering on Duration and Contact Center. All agents will be shown in the dropdown. You can do multiple filtering based on those 3 criteria. If no filtering is done, data is shown for all contact centers (Tenant level) and for all available agents.
Numeric Widgets
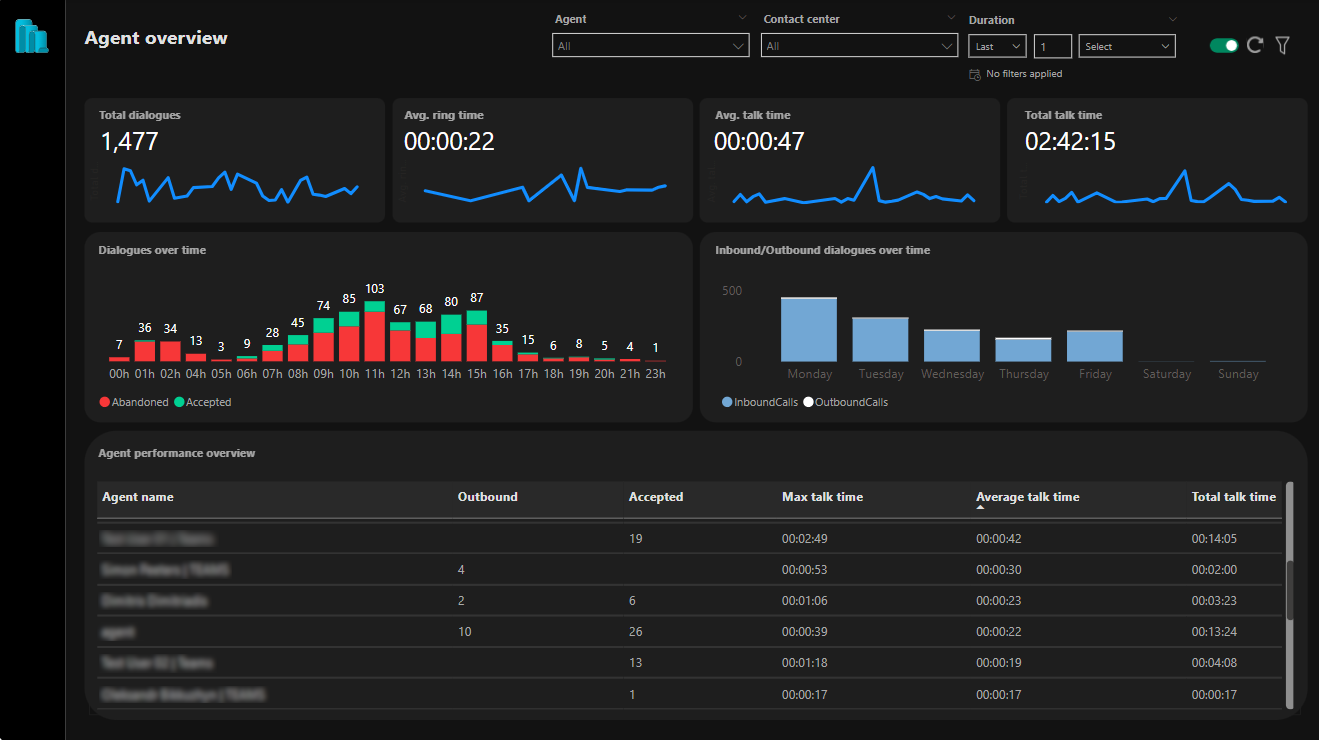
There are currently four numeric widgets:
-
Total Dialogues: Total number of dialogues.
-
Average Ring Time: Average ring time over the selected time period.
-
Average Talk Time: Average talk time over the selected time period.
-
Total Talk Time: Total talk time over the selected time period.
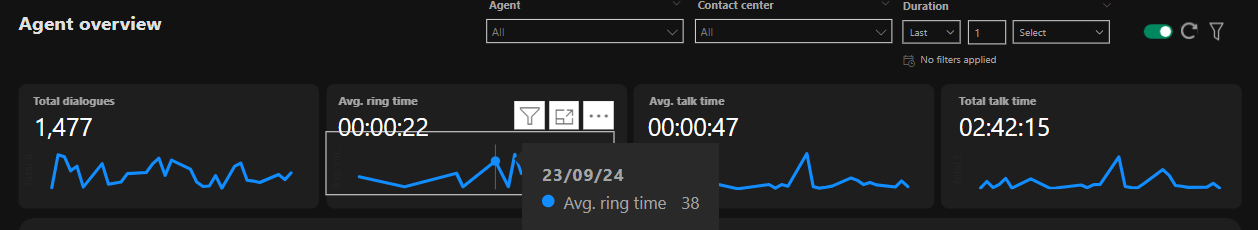
There is a line chart available in blue to show the trend over time. Once hovering over this line, a tooltip appears to show the specific time related information can be shown at each level of the line chart (shown below).
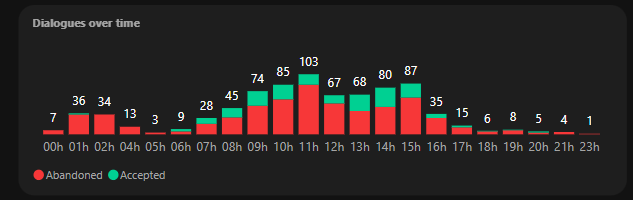
Dialogues Over Time
A stacked bar diagram is shown for both Abandoned and Accepted calls over time. The default view shows the distribution among the hours of the day. A drill up/down option is available to aggregate the data over months and years span.
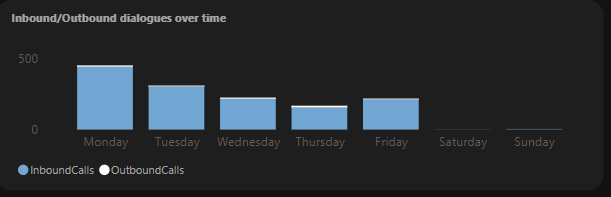
Inbound/outbound over time
A stacked bar diagram is shown for both Inbound and Outbound calls over time. A default view shows distribution over weekdays.
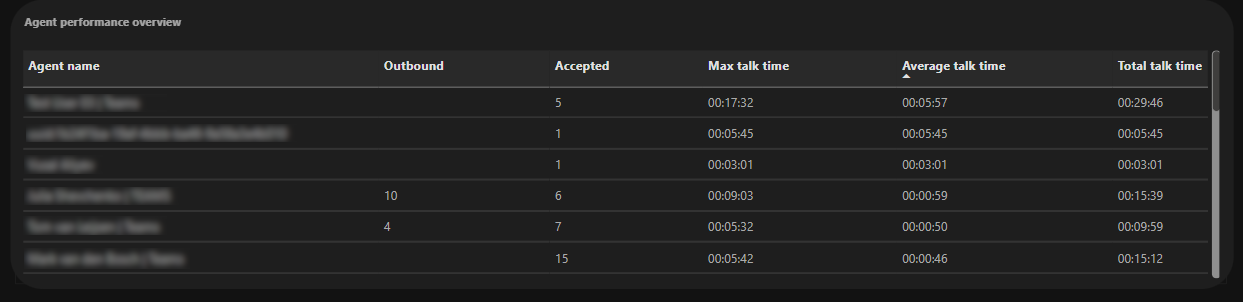
Agents performance overview
This is the main agents table that shows relevant KPIs per agent.
The table includes:
-
Agent name: name of an agent.
-
Outbound: the total number of outbound dialogues per agent.
-
Accepted: the total number of inbound accepted calls per agent.
-
Max talk time: Maximum talk time an agent spent talking to a single customer ( inbound and outbound calls ).
-
Average talk time: The average amount of time an agent talks to a customer ( inbound and outbound calls ).
-
Total talk time: Total talk time an agent spent talking to customers ( inbound and outbound ).
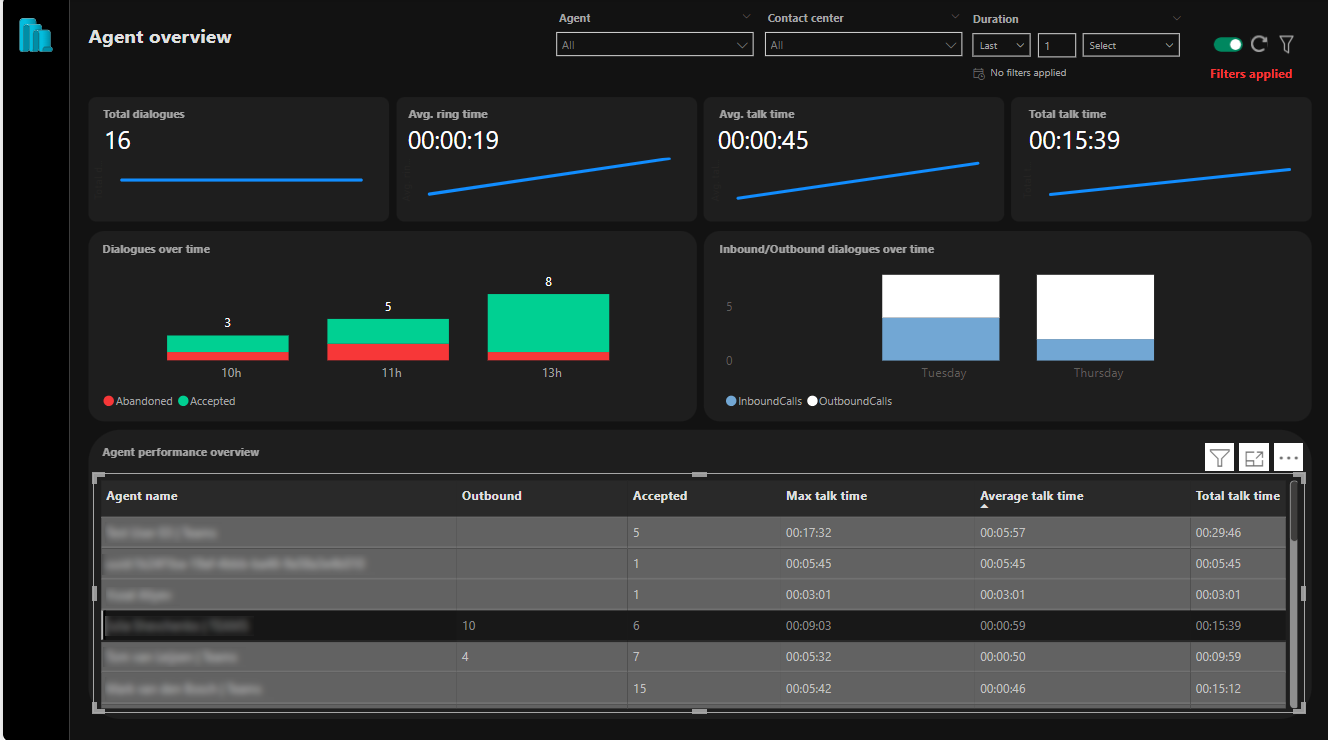
Filtering for a specific agent can be done by clicking on the table row. The data for this agent will be reflected throughout the reporting page ( as seen below ).