Dialogue Skills Page in PowerBI
Overview
Dialogue Skills page will focus on all Skill related insights.
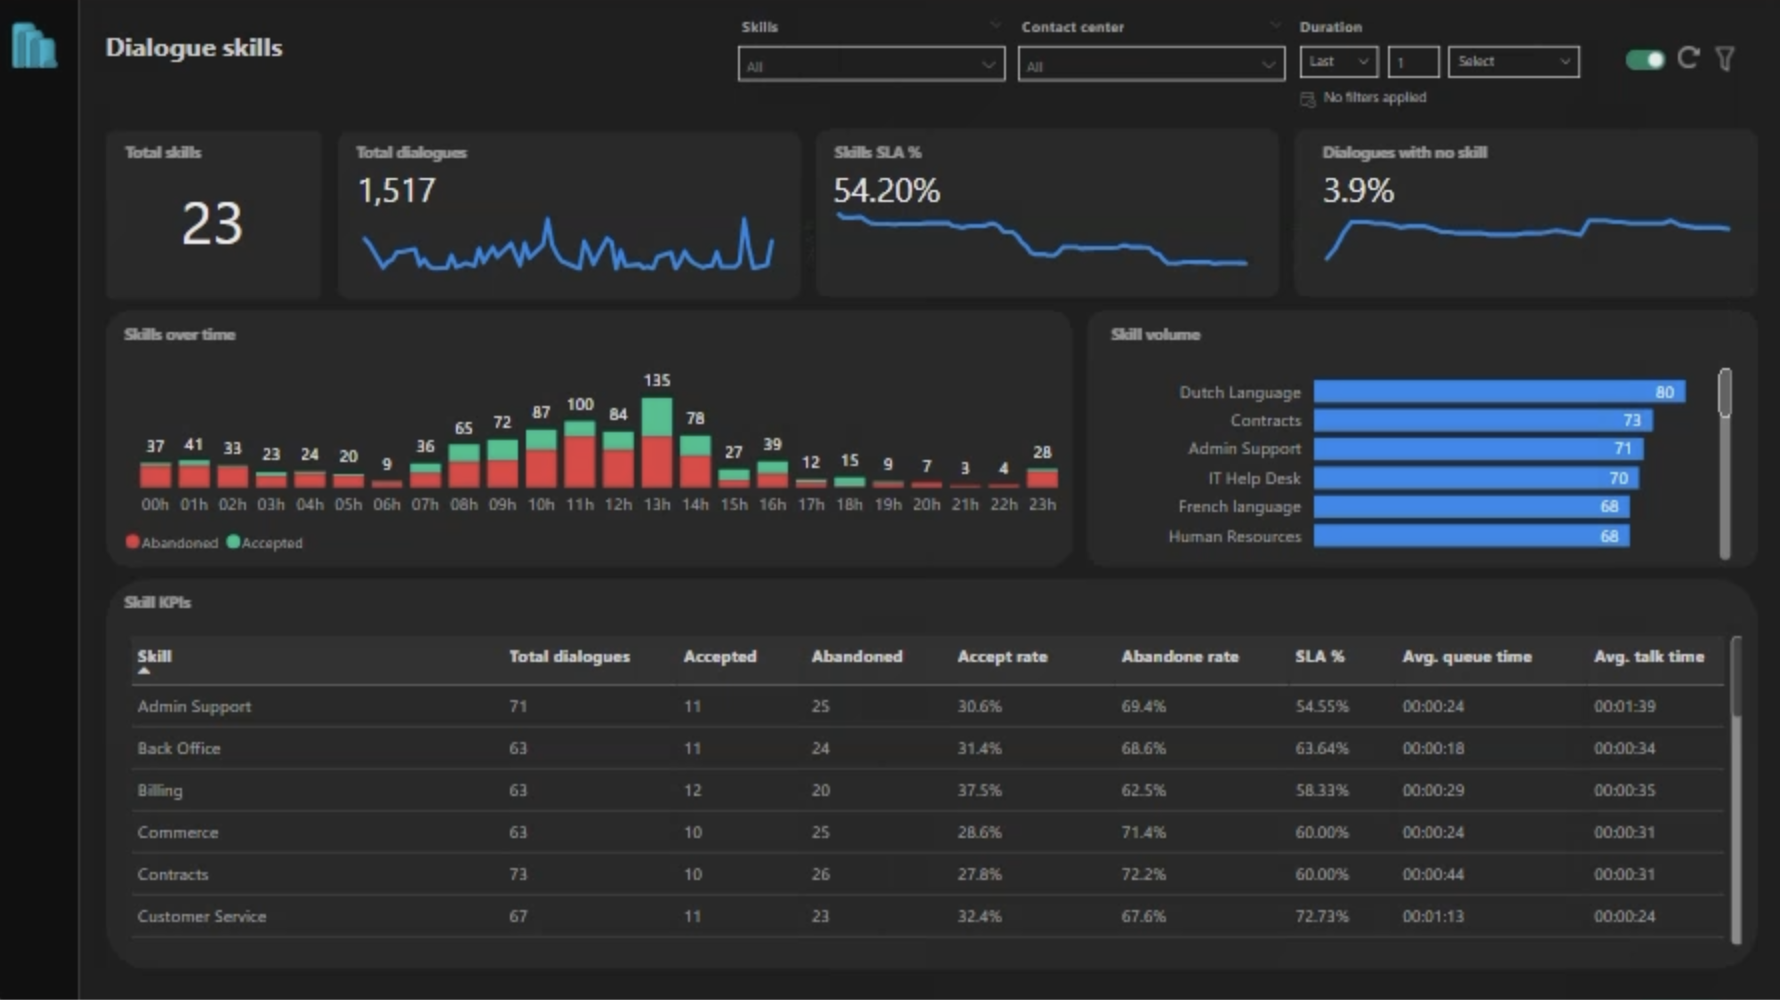
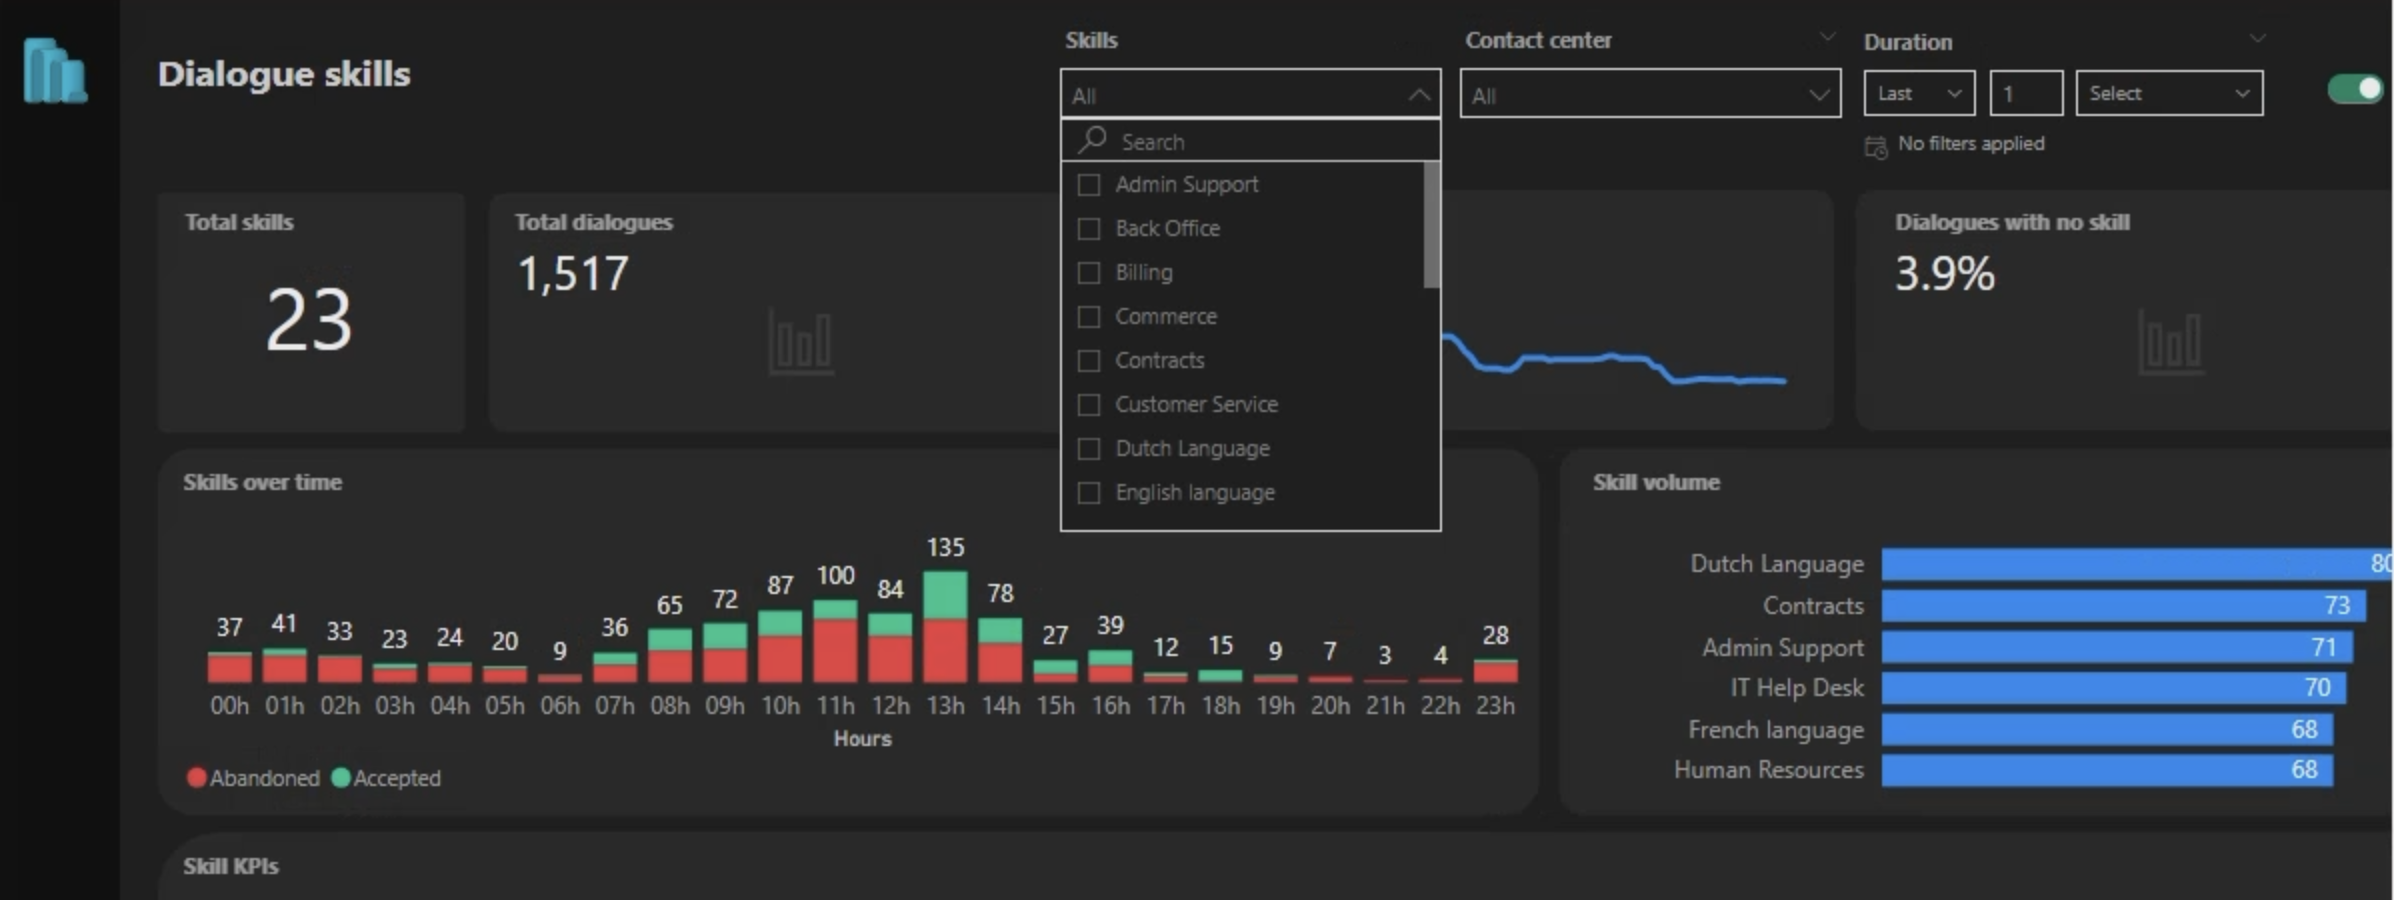
Filtering
This page introduces has filtering (slicing) option for Skills, in addition to the existing filters for Duration and Contact Center. All skills relevant to a contact center will be shown in the dropdown. You can apply multiple filters based on these three criteria. If no filters are applied, data for all contact centers (Tenant level) and all available skills will be displayed.
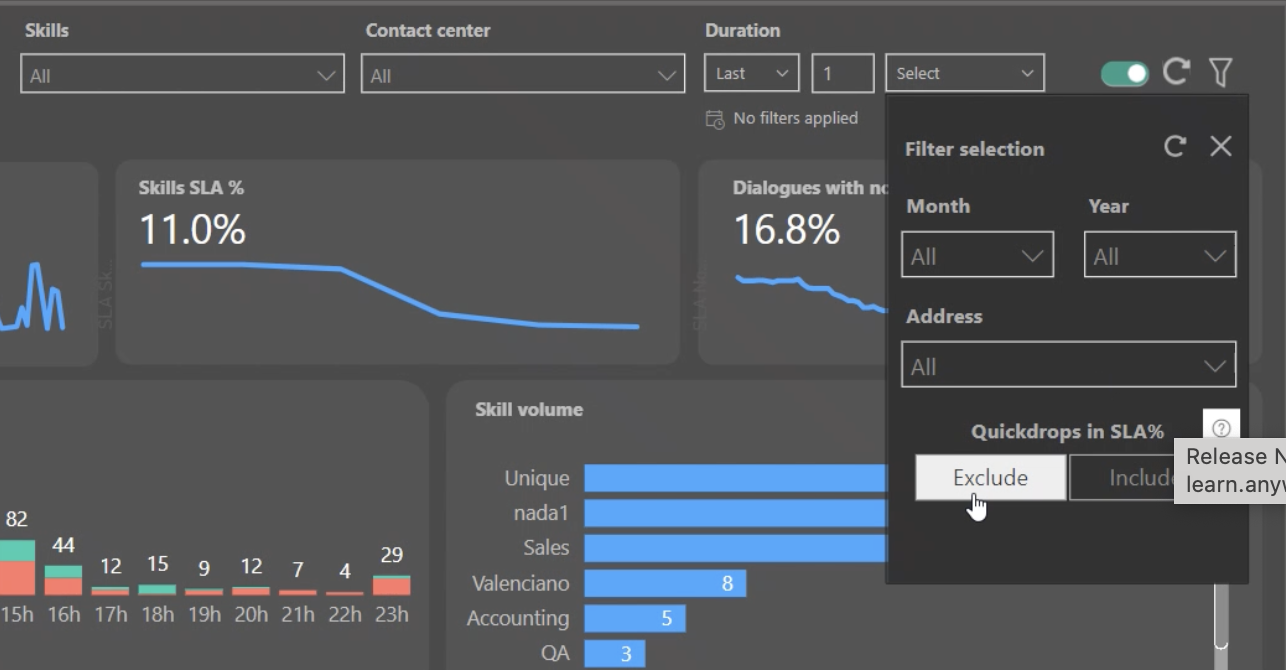
Additionally, Quickdrops filtering is available on this page. By clicking the filter button, you can include or exclude Quickdrops in the SLA calculation.
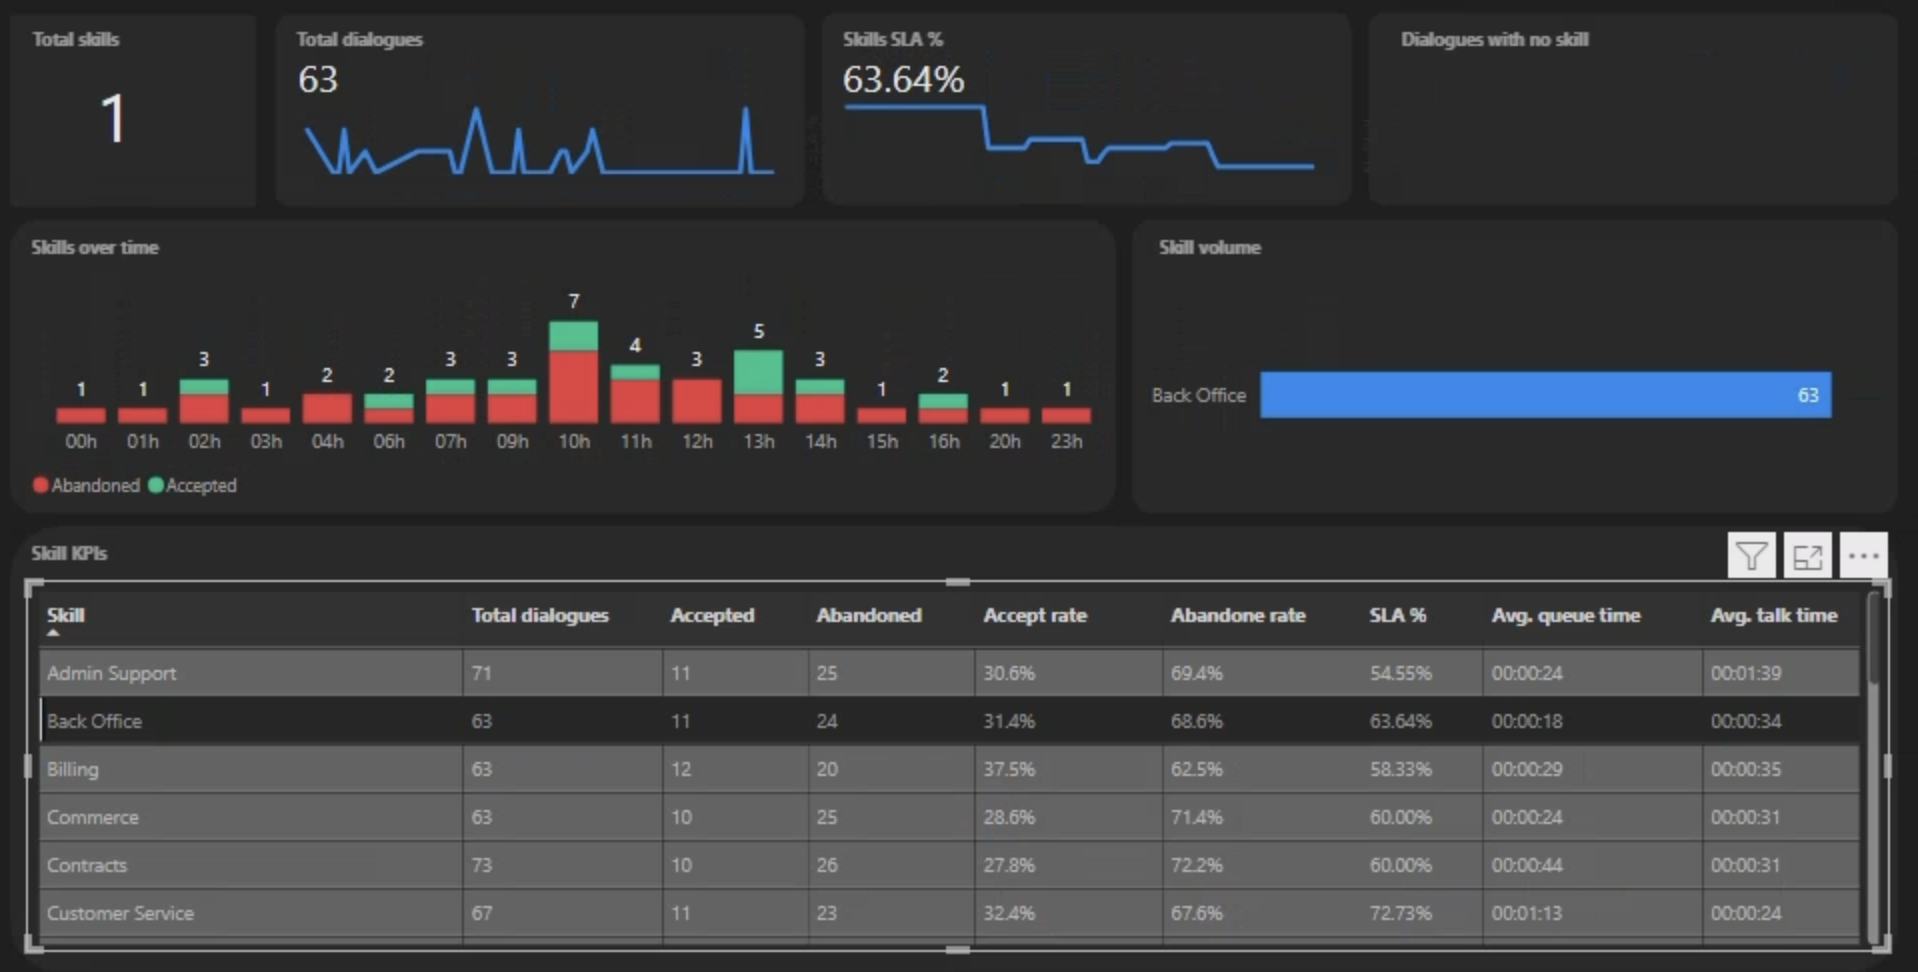
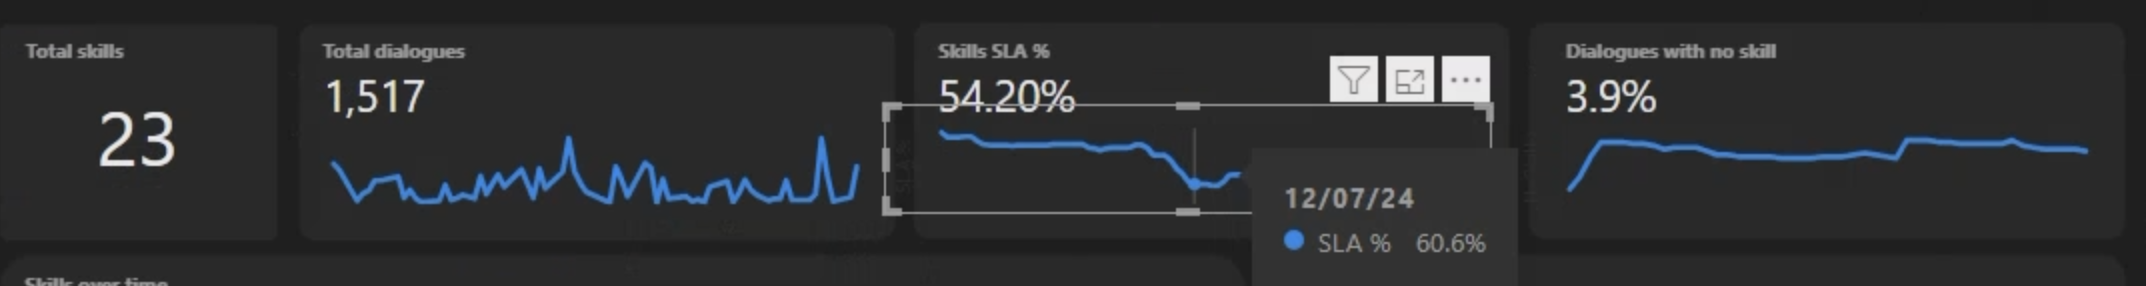
Numeric Widgets
There are currently four numeric widgets:
-
Total Skills: Total number of skills available with dialogues.
-
Total Dialogues: Total number of dialogues per day.
-
Skills SLA: Running total SLAs expressed as a percentage.
-
Dialogue with No Skill: Running total number of dialogues with no skills, expressed as a percentage.
A line chart in blue shows the trend over time. Hovering over the line displays a tooltip with specific time-related information.
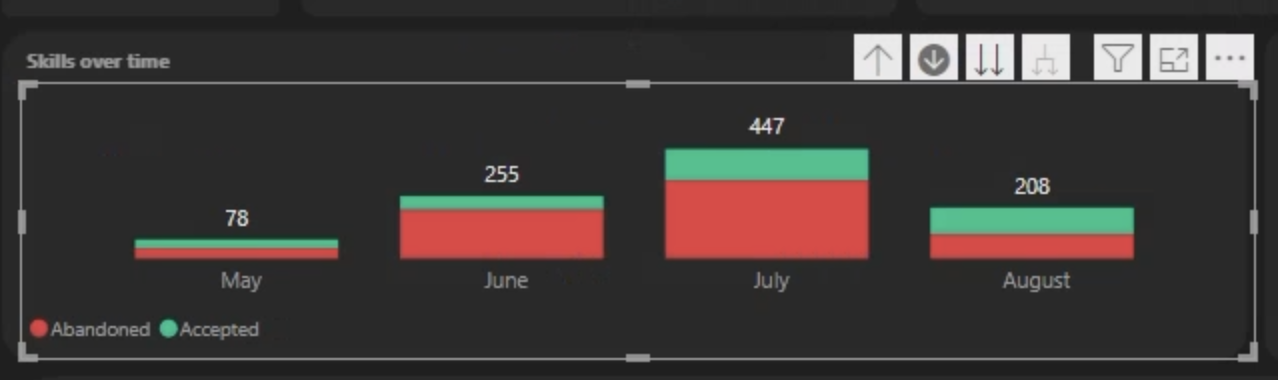
Skills Over Time
A stacked bar diagram displays both Abandoned and Accepted calls over time. The default view shows the distribution by hours of the day. A drill up/down option is available to aggregate the data over months and years.
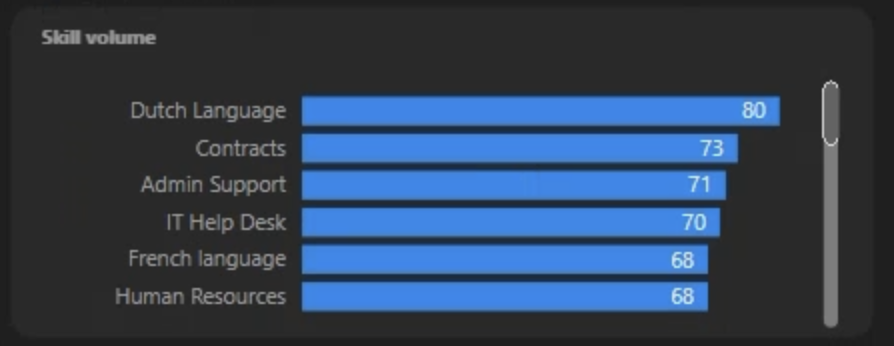
Skills Volume
The Skills Volume chart shows the distribution of the most frequently used skills in dialogues, sorted in descending order.
Skills KPI Table
This table displays relevant KPIs for each skill:
-
Skill Name: Name of the unique skill in dialogues.
-
Total Dialogues: Total number of dialogues per unique skill.
-
Accepted: Total number of accepted calls per skill.
-
Abandoned: Total number of abandoned calls per skill.
-
Accepted Rate: Percentage of answered calls in relation to the total number of calls per skill.
-
Abandoned Rate: Percentage of abandoned calls in relation to the total number of calls per skill.
-
SLA%: Benchmark of the Service Level Agreement, expressed as a percentage per skill.
-
Avg. Queue Time: Average duration a customer waits before their call is answered per skill.
-
Avg. Talk Time: Average amount of time an agent talks to a customer during an interaction per skill.
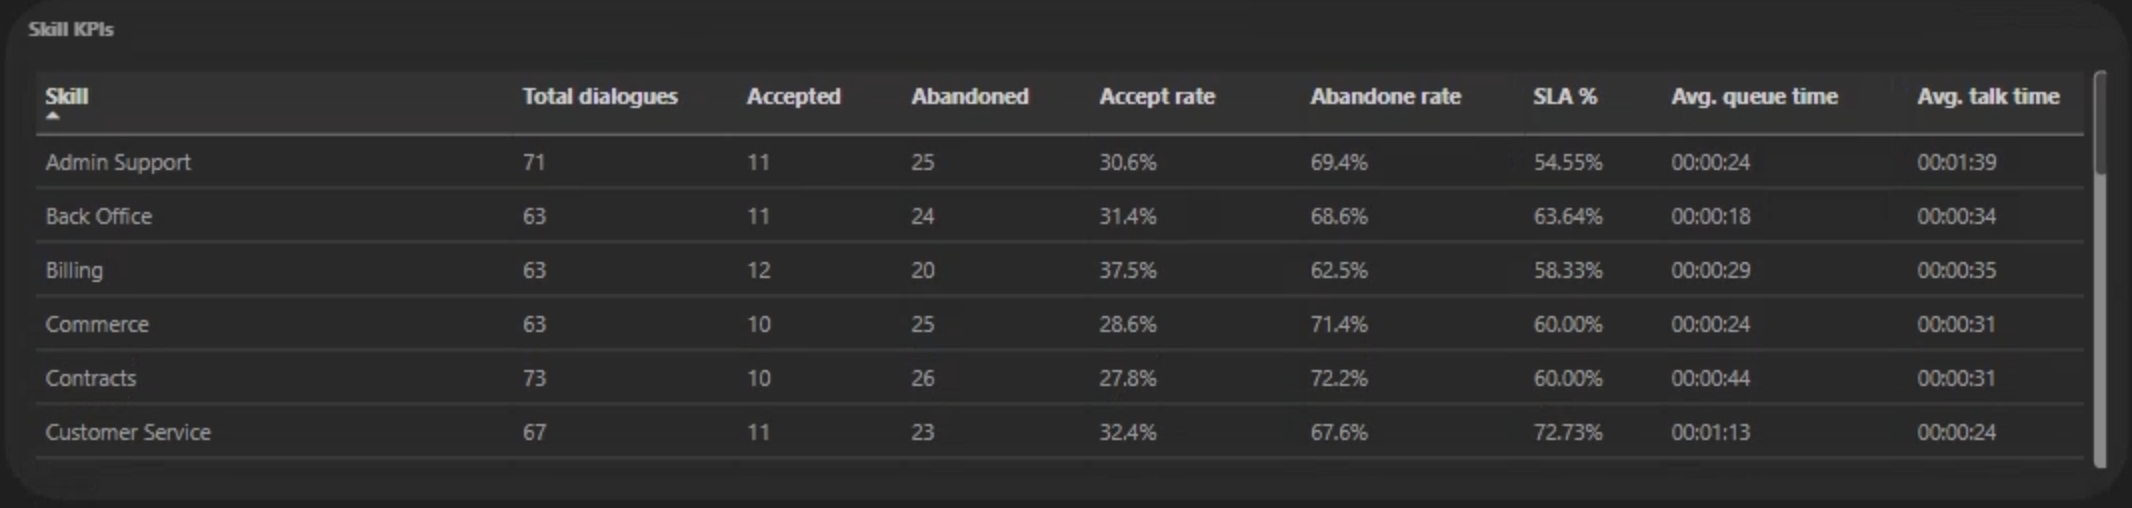
You can filter for a specific skill by clicking on the desired row. The data for this skill will be reflected throughout the reporting page.